
Transportation Costs as a Household Budget Category: What Most People Underestimate

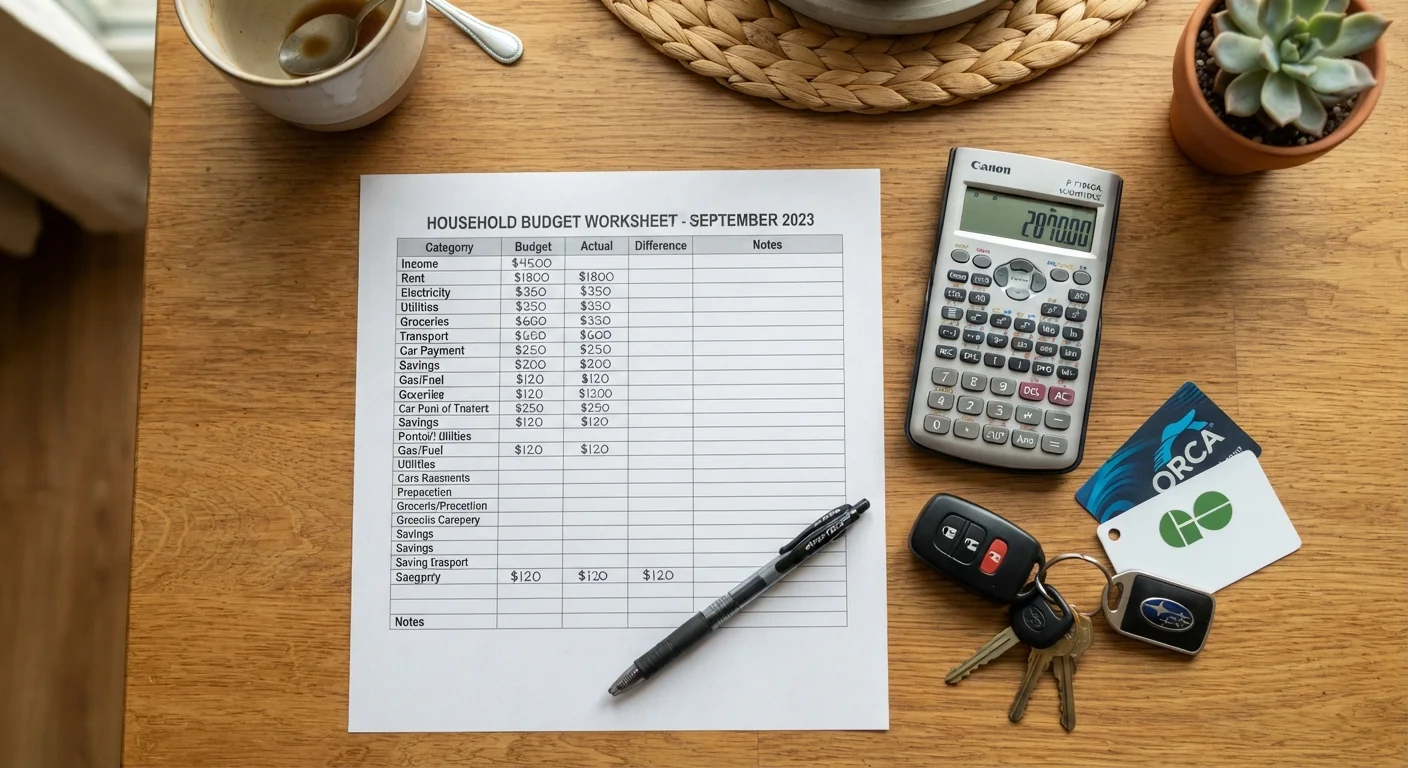
Photo: InfoAlly.net | Finding Info Made Easy editorial
Key Takeaways
- Transportation is typically a household's second-largest expense after housing, often exceeding 15-20% of income.
- Most people undercount transportation costs by forgetting depreciation, parking, insurance, and occasional rideshare fees.
- A multimodal approach - combining transit, rideshare, and personal vehicles - can reduce overall transportation spending.
- Tracking all transportation sub-categories separately reveals spending patterns that a single budget line obscures.
- Household transportation needs vary significantly by location, lifestyle, and number of drivers - no single strategy fits all.
Why Transportation Costs Are So Easy to Undercount
Ask most people what they spend on transportation, and they'll cite their car payment or their monthly transit pass. Both answers are incomplete. Transportation is a category made up of many overlapping sub-categories, and the full picture almost always comes out higher than people expect.
According to the U.S. Bureau of Labor Statistics Consumer Expenditure Survey, transportation routinely ranks as the second-largest household expense category after housing - yet it receives far less deliberate budget attention. The gap between perceived and actual transportation spending is one of the most common sources of budget shortfalls for American households.
The core reason: many costs are irregular, invisible, or mentally filed somewhere else. Depreciation, for instance, is a real economic cost of vehicle ownership that never shows up in a bank statement. Parking fees paid in cash, tolls, occasional rideshare charges, and roadside assistance memberships all tend to get absorbed into discretionary spending rather than counted as transportation.
Location Shapes Transportation Costs Dramatically
For a broader view of how major purchases generate ongoing costs, see The Hidden Costs That Follow a Big Purchase.
The Full Inventory: What Belongs in This Budget Category
Building an accurate transportation budget requires listing every sub-category, not just the obvious ones. Here is a practical inventory to work from:
- Vehicle ownership fixed costs: Loan or lease payments, insurance premiums, registration fees, and personal property taxes where applicable.
- Vehicle operating costs: Fuel or charging costs, oil changes, tires, routine maintenance, and unexpected repairs.
- Depreciation: Vehicles lose value over time. While this doesn't leave your checking account monthly, it represents a real cost when you eventually sell or trade in.
- Parking and tolls: Monthly garage fees, street parking, work parking, and toll roads or bridge crossings.
- Public transit: Monthly passes, single-ride fares, and commuter rail or ferry fees.
- Rideshare and car-share: App-based rides, car-share membership fees, and per-use charges.
- Micro-mobility: E-bike purchases or rentals, scooter share fees, and bike maintenance.
- Roadside and travel: AAA or equivalent memberships, airport parking, and rental cars during travel.
Many households find that simply listing these categories - before assigning dollar amounts - reveals spending they hadn't previously connected to transportation at all. See Car Ownership Costs That Catch New Drivers Off Guard for a deeper breakdown of vehicle-specific expenses.
Track every transportation sub-category separately for at least 60 days before setting a budget target.
Include a monthly depreciation estimate for any vehicle you own outright.
Evaluate whether rideshare or car-share could replace some - not necessarily all - personal vehicle trips.
Review parking and toll costs quarterly - they tend to grow quietly without triggering attention.
Rethinking the Budget: Strategies That Match Your Actual Situation
Once you have an accurate picture of what you're spending, the next step is evaluating whether that spending aligns with your household's priorities and location realities. A rural household with no transit options faces fundamentally different constraints than a household in a city with robust public transportation.
~17%
Share of household spending on transportation
The U.S. Bureau of Labor Statistics Consumer Expenditure Survey consistently finds transportation accounting for roughly 16-18% of average household expenditures annually.
$12,000+
Estimated annual cost of owning and operating a vehicle
AAA's annual Your Driving Costs study estimates total ownership and operating costs for a typical new vehicle, including depreciation, insurance, fuel, and maintenance.
One framework worth considering: think of transportation spending in terms of access cost per trip or per mile rather than monthly totals alone. This comparison can make alternatives like transit, e-bikes, or rideshare more directly comparable to car ownership for specific trip types.
Multimodal approaches - combining a personal vehicle for some trips with transit or rideshare for others - often reduce total transportation spending meaningfully for households near urban cores. Multimodal Commuting: Building a Daily Route That Combines Multiple Transport Types explores how to build this kind of hybrid approach practically.
For households sharing finances, transportation decisions are also a communication challenge. Budgeting as a Household: Shared Finances Without the Arguments offers approaches for aligning on spending categories when multiple people have different transportation needs and preferences.
This article is for general informational and educational purposes only. It does not constitute personalized financial advice. Consult a qualified financial professional for guidance specific to your household's situation.
The content on this site is for informational purposes only and is not a substitute for professional advice. Always consult a qualified professional for guidance specific to your situation.